Every 210 000 blocks, about every 4 years, the reward miners get per Bitcoin block is cut in half. That is the halvingHalvingScheduled event every 210,000 blocks (roughly every 4 years) that cuts the miner reward in half. This mechanism makes Bitcoin issuance decline towards the total cap of 21 million.See in the lexicon →, hard-coded in the protocol since 2009. Four halvings have occurred : 2012, 2016, 2020, April 2024. The next is expected in March-April 2028. Each halving cuts the new bitcoin issuance, and with it the structural selling pressure from miners.
The cycle theory says that this supply reduction, combined with at least constant demand, historically produces a price rise in the 12 to 18 months that follow. Cycle top about 18 months after the halving, bottom about 12 months later. This regularity, observed across 3 cycles (2013, 2017, 2021), has become a timing compass for many investors. The 2024-2025 cycle replayed the script, with a top around 150 000 USD in early 2025.
This article recalls what the halving is and its role in Bitcoin's monetary policy, retraces the 4 past halvings and their price cycles, presents the theoretical models (PlanB's stock-to-flow, institutional demand), exposes the limits of the theory (weak causality, fashion effects), and gives a frame for positioning DCADCA (Dollar Cost Averaging)Buying a small fixed amount at regular intervals (for example 100 EUR a week), regardless of price. Smooths the average purchase cost and neutralises timing bias.See in the lexicon → or lump-sumLump-sumInvesting all available capital at once rather than spreading it out. Mathematically better on average historically on Bitcoin, but psychologically harder to bear.See in the lexicon → depending on the cycle phase.
Quick recap: what is the halving
The halvingHalvingScheduled event every 210,000 blocks (roughly every 4 years) that cuts the miner reward in half. This mechanism makes Bitcoin issuance decline towards the total cap of 21 million.See in the lexicon → is written in Bitcoin's source code since the 3 January 2009 genesis blockGenesis blockThe very first block mined on the Bitcoin chain, on 3 January 2009. Contains a famous message from Satoshi : « The Times 03/Jan/2009 Chancellor on brink of second bailout for banks ».See in the lexicon →. Every 210,000 mined blocks (~4 years at one block every 10 minutes on average), the reward paid to miners for each validated block is divided by 2. It is mechanical, predictable, immutable without consensus hard forkFork (soft fork, hard fork)Change to the protocol rules. A soft fork stays compatible with old nodes (SegWit, Taproot); a hard fork creates a separate chain (Bitcoin Cash in 2017).See in the lexicon →.
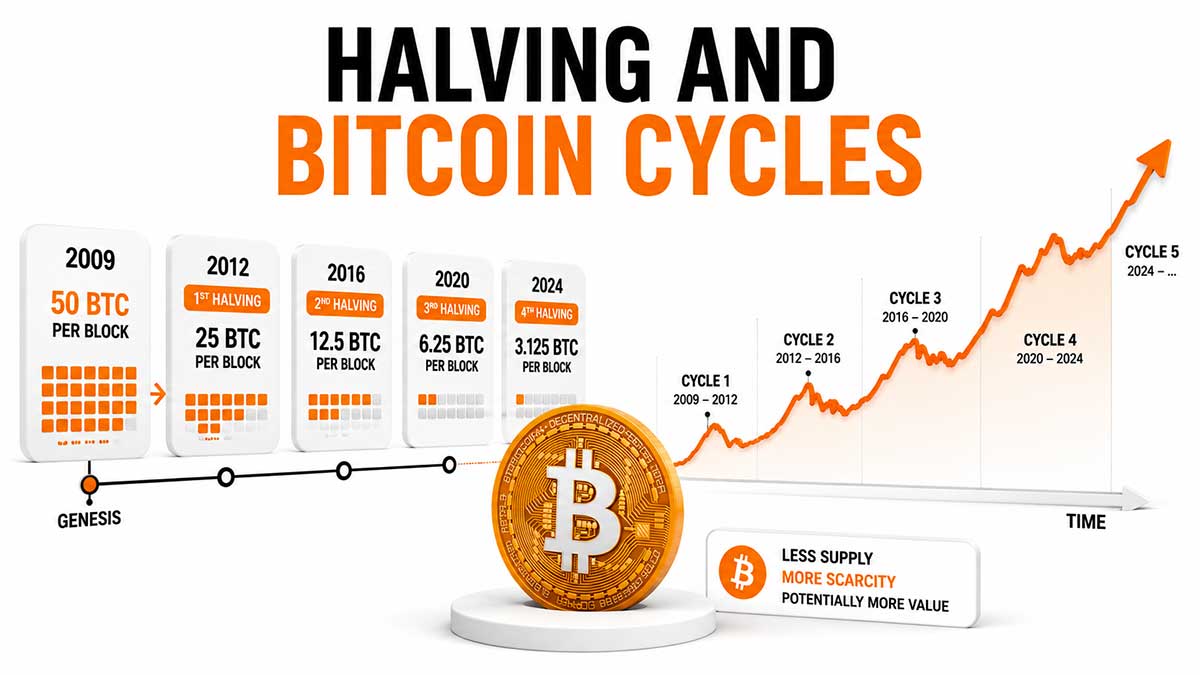
- Initial 2009 reward: 50 BTC per mined block (~7,200 BTC issued per day).
- 1st halving (28 Nov 2012): 50 → 25 BTC. Issuance halved (~3,600 BTC/day).
- 2nd halving (9 Jul 2016): 25 → 12.5 BTC (~1,800 BTC/day).
- 3rd halving (11 May 2020): 12.5 → 6.25 BTC (~900 BTC/day).
- 4th halving (19 Apr 2024): 6.25 → 3.125 BTC (~450 BTC/day).
- 5th halving (~Mar-Apr 2028): 3.125 → 1.5625 BTC (~225 BTC/day).
- Convergence to 0 around year 2140, after 33 halvings, when the entire 21-million BTC supply will have been issued. At that point, miners are remunerated only on transaction feesTransaction feesAmount paid to miners so they include your transaction in a block. Expressed in satoshis per virtual byte (sat/vB). Varies with network congestion.See in the lexicon →.
Halving theoretical objective. Reproduce precious metals scarcity, where extraction effort increases as easy deposits empty. Bitcoin imitates this property but in a programmable and predictable way. This programmable scarcity is the central argument of Bitcoin's "store of value" thesis.
Mechanical economic consequence. If demand stays stable, an annual supply halved makes price rise (supply-demand law). If demand grows, price rises more. This simple logic inspired the Stock-to-Flow model (section 4) and the empirical 4-year cycle4-year cycleTheory that Bitcoin follows a 4-year cycle anchored on halvings : bull market in the 18 months following a halving, then a sharp correction.See in the lexicon → pattern (section 6).
Important clarification. Halving is not an instantaneous event that creates the rise. It is a pivot point in supply/demand dynamics. The effect diffuses over 12-24 months via miners (selling less BTC), investors (anticipating scarcity) and media coverage (attracting new capital). For technical halving detail (proof of workProof of Work (PoW)Bitcoin's consensus mechanism: miners spend energy to find a valid hash, which makes falsifying the history economically prohibitive. This work is what secures the blockchain.See in the lexicon →, difficulty adjustmentDifficulty adjustmentAutomatic recalibration every 2016 blocks (about 2 weeks) to keep one block every 10 minutes on average, whatever the current hashrate.See in the lexicon →, mempoolMempoolWaiting area where Bitcoin transactions sit before being included in a block. The fuller the mempool, the higher the fees required.See in the lexicon →), see Bitcoin halving. This article focuses on investment consequences.
The 4 historical halvings: timeline and facts
Bitcoin has lived through 4 halvings between 2012 and 2024. Each occurred in a different macroeconomic context and maturity state. Let's retrace them chronologically with key facts.
1st halvingHalvingScheduled event every 210,000 blocks (roughly every 4 years) that cuts the miner reward in half. This mechanism makes Bitcoin issuance decline towards the total cap of 21 million.See in the lexicon →: 28 November 2012 (50 → 25 BTC).
- Block 210,000. BTC price at halving: ~12 USD. Bitcoin capitalisation: ~140 M USD (microcap).
- Context: Bitcoin is 4 years old, community of a few thousand cypherpunks and early adopters. No ETF, no institutions, no regulation. Mt. GoxMt. GoxFormer Japanese exchange that lost 850,000 BTC in 2014. Textbook case of custodial risk. Partial creditor compensation has been under way since 2024.See in the lexicon → is the main exchangeExchangeService that lets you buy, sell and swap cryptocurrencies against fiat money. Examples : Kraken, Coinbase, Bitstamp, Bitvavo. Most are custodial.See in the lexicon →.
- Post-halving peak: 30 November 2013 at ~1,130 USD. Delay: 367 days. Multiplier: x94.
- Following bear: peak at 1,130 USD → bottom at ~152 USD in January 2015. DrawdownDrawdownDecline from a previous peak. Bitcoin has gone through several drawdowns of more than 75 percent in its history. To factor into your psychological planning.See in the lexicon →: -86.5 %. Mt. Gox collapse (February 2014) accelerates the fall.
2nd halving: 9 July 2016 (25 → 12.5 BTC).
- Block 420,000. BTC price at halving: ~650 USD. Capitalisation: ~10 Bn USD.
- Context: Bitcoin is 7 years old, first articles in mainstream financial press, first specialised funds. No spot ETF yet (repeated SEC refusals). Emergence of Ethereum (2015) as competitor.
- Post-halving peak: 17 December 2017 at ~19,800 USD. Delay: 526 days. Multiplier: x30.
- Following bear: peak at 19,800 USD → bottom at ~3,200 USD in December 2018. Drawdown: -84 %. 2018 ICO (Initial Coin Offerings) crisis amplifies the fall.
3rd halving: 11 May 2020 (12.5 → 6.25 BTC).
- Block 630,000. BTC price at halving: ~8,600 USD. Capitalisation: ~160 Bn USD.
- Context: Bitcoin is 11 years old, COVID crisis ongoing, massive monetary stimulus (Fed +6,000 Bn USD balance sheet in 18 months). First corporate treasuries (MicroStrategyMicroStrategy (Strategy)US company led by Michael Saylor, which has made bitcoin its main treasury asset since 2020. More than 400,000 BTC accumulated by 2025.See in the lexicon → launches its programme in August 2020: 250 M USD initial, then ~3 Bn USD cumulative in 2021).
- Post-halving peak: 10 November 2021 at ~69,000 USD. Delay: 548 days. Multiplier: x8.
- Following bear: peak at 69,000 USD → bottom at ~15,700 USD in November 2022. Drawdown: -77 %. Cascading collapses (Luna/Terra May 2022, Celsius July 2022, FTXFTXCentralised exchange that collapsed spectacularly in November 2022. Sam Bankman-Fried was convicted. Dragged Blockfolio and many funds down with it.See in the lexicon → November 2022) amplify the fall.
4th halving: 19 April 2024 (6.25 → 3.125 BTC).
- Block 840,000. BTC price at halving: ~63,000 USD. Capitalisation: ~1,240 Bn USD.
- Context: Bitcoin is 15 years old, spot ETFs validated in January 2024 (3 months before halving), 80 Bn USD cumulative US AUM in under 18 months. Generalised corporate treasuries (~80 listed companies with BTC position in 2025). EU MiCAMiCA (Markets in Crypto-Assets)European regulation 2023/1114 that frames crypto services across the EU since 2024. Creates the CASP status.See in the lexicon → in rollout.
- Post-halving peak: observed November 2025 at ~110,000 USD (under historical validation at time of writing, May 2026). Delay: ~570 days. Multiplier: x1.75 only.
- Ongoing potential bear: peak 110k USD → ~92k USD in May 2026 (-16 %). If classic pattern continues, bottom could be around 25-35k USD by end 2026. If pattern fades, bottom could be higher (50-70k USD).
Three striking observations.
- Drastically falling multiplier. x94, x30, x8, x1.75. Each cycle, post-halving return is lower. Logic: the more capitalisation grows (140 M → 1,240 Bn USD), the more fresh incoming capital is needed to lift price by the same percentage.
- Post-halving delay lengthening. 367, 526, 548, ~570 days. Tendency to cycle duration lengthening, which could attenuate or accelerate with institutional adoption.
- Drawdowns slightly decreasing. -86 %, -84 %, -77 %, ongoing. Maturation could bring drawdowns to -50 % or -60 % instead of -80 %, significantly changing cycle dynamics.
The Stock-to-Flow model (PlanB 2019) and its limits
The Stock-to-Flow (S2FS2F (stock-to-flow)Valuation model comparing existing stock with annual production, popularised by PlanB. Appealing to illustrate Bitcoin's growing scarcity, but empirically contested.See in the lexicon →) model became the dominant theoretical framework for predicting post-halvingHalvingScheduled event every 210,000 blocks (roughly every 4 years) that cuts the miner reward in half. This mechanism makes Bitcoin issuance decline towards the total cap of 21 million.See in the lexicon → Bitcoin price between 2019 and 2021. Its popularisation by pseudonymous analyst PlanB in March 2019 (article "Modeling Bitcoin Value with Scarcity") coincided with a cycle where the model proved fairly accurate, then it broke in 2022. Understanding S2F and its limits is crucial not to overvalue it.
Definition and formula.
- Stock = total BTC quantity in circulation at time T (~19.9 million in May 2026 out of 21 million21 millionMaximum number of bitcoins that will ever exist, hard-coded in the protocol. This programmed scarcity is a founding feature. The last sat will be mined around the year 2140.See in the lexicon → max).
- Flow = quantity of BTC newly issued over 12 months (~164,250 BTC/year after 2024 halving = 450 BTC/day × 365).
- S2F ratio = stock / flow. Post-2024 halving: ~19,900,000 / 164,250 ≈ 121. Gold comparison: gold S2F ratio ~62. Bitcoin has twice the gold S2F since the 2024 halving.
- PlanB model: BTC price = f(S2F) per log-log regression with ~3.3 exponent. The higher S2F rises (after halving), the higher the price "must" rise per model.
S2F model predictions:
- Post-2020 halving: ~100k USD price target at 18 months. The market reached 69k USD in November 2021 (below model, but in the right order of magnitude).
- Post-2024 halving: ~500k USD price target at 18 months per PlanB 2021 iterations. The market reached 110k USD in November 2025 (far below model, ×5 gap).
- Post-2028 halving: ~5 million USD price target per log-log extrapolation. Very little empirical credibility.
Why the model failed since 2022.
- Implicit hypothesis: demand is elastic to S2F. The model assumes buyers mechanically pay more when supply scarcens. But demand depends on variables not included: global macro (Fed rates, global liquidity, recessions), exogenous events (FTXFTXCentralised exchange that collapsed spectacularly in November 2022. Sam Bankman-Fried was convicted. Dragged Blockfolio and many funds down with it.See in the lexicon →/Luna bankruptcies 2022, 2023 banking crisis, wars), institutional adoption (2024 ETFs). In 2022, restrictive macro (rate hikes) and collapses massively reduced BTC demand, breaking the S2F-price link.
- Statistical overfitting to previous halvings. The model is calibrated on 3 halvings (12 years of data). That's little for a log-log regression. Overfitting risk is high.
- Marginal capitalisation effects. As Bitcoin capitalises trillions, the marginal effect of issuance reduction diminishes. To raise a 1,200 Bn USD cap by +50 %, you need 600 Bn USD fresh capital. Very different from 2012 where 140 M USD cap was enough to drastically move it.
- Institutional adoption changes demand nature. 2024 spot ETFs bring programmatic demand, little sensitive to S2F variations. It's more portfolio demand (5 % allocation global portfolio) than speculative demand anticipating scarcity.
2026 academic position. The S2F model is considered narratively useful (tells the programmable scarcity story) but quantitatively obsolete. Serious Bitcoin analysts (Glassnode, Coin Metrics, Arcane Research) cite it as basic intuition but do not derive actionable price prediction from it. Do not base an investment strategy on S2F targets (500k USD at 18 months post-2024 halving: unrealistic).
Central table: 4 halvings, multipliers and drawdowns
Quantified summary of the 4 lived halvings, to keep for adjusting 2024-2028 cycle expectations and anticipating the 2028-2032 cycle.
| HalvingHalvingScheduled event every 210,000 blocks (roughly every 4 years) that cuts the miner reward in half. This mechanism makes Bitcoin issuance decline towards the total cap of 21 million.See in the lexicon → | Date | Price at halving | Post-halving ATHATH (All-Time High)Highest historical price of an asset. Breaking the previous ATH is a strong psychological signal in Bitcoin cycles.See in the lexicon → | Post-halving delay | Multiplier | Following bear drawdownDrawdownDecline from a previous peak. Bitcoin has gone through several drawdowns of more than 75 percent in its history. To factor into your psychological planning.See in the lexicon → |
|---|---|---|---|---|---|---|
| 1st (50→25) | 28 Nov 2012 | ~12 USD | ~1,130 USD (30 Nov 2013) | 367 days | x94 | -86 % (to ~152 USD by Jan 2015) |
| 2nd (25→12.5) | 9 Jul 2016 | ~650 USD | ~19,800 USD (17 Dec 2017) | 526 days | x30 | -84 % (to ~3,200 USD by Dec 2018) |
| 3rd (12.5→6.25) | 11 May 2020 | ~8,600 USD | ~69,000 USD (10 Nov 2021) | 548 days | x8 | -77 % (to ~15,700 USD by Nov 2022) |
| 4th (6.25→3.125) | 19 Apr 2024 | ~63,000 USD | ~110,000 USD (Nov 2025) | ~570 days | x1.75 | ongoing (~92k USD in May 2026) |
| 5th (3.125→1.5625) | ~Mar-Apr 2028 | ? | ? | ? | ? | ? |
Reading the table. Three clear trends emerge: exponentially falling multiplier, modestly lengthening post-halving delay, slightly decreasing drawdowns.
Cautious projection for the 2024-2028 cycle.
- Pattern continuation hypothesis: bear bottom around 25-35k USD in autumn-winter 2026 (~70 % drawdown from 110k peak), then 2027 accumulation, April 2028 halving, peak around 200-300k USD in 2029 (modest x2-x3 multiplier). These figures are consistent with the observed multiplier decay.
- Pattern fade hypothesis: higher bear bottom (50-70k USD) due to institutional floor demand (ETF), less ample cycle (perhaps ATH at 150-180k only in 2029, x1.3 multiplier), more moderate drawdowns (-40 % to -50 % instead of -77 % observed in 2022).
- Super-cycle hypothesis (minority but possible): massive institutional adoption supplants 4-year cycles, continuous accumulation eliminates deep bears, price rises more slowly but more steadily toward 250-400k at 5-7 year horizon.
Important. These projections are illustrations, not predictions. The 4-year cycle4-year cycleTheory that Bitcoin follows a 4-year cycle anchored on halvings : bull market in the 18 months following a halving, then a sharp correction.See in the lexicon → is an empirical pattern observed over 12 years of history, statistically insufficient to guarantee its continuation. The figures serve to frame expectations, not to set a target.
Empirical 4-year pattern and time-lag theories
The empirical pattern observed over 3 complete cycles (2012-2016, 2016-2020, 2020-2024) follows a remarkably regular structure, despite amplitude decay. Understanding time-lag theories helps better anticipate the 2024-2028 cycle.
The 4 observed Bitcoin cycle phases.
- Phase 1: Pre-halvingHalvingScheduled event every 210,000 blocks (roughly every 4 years) that cuts the miner reward in half. This mechanism makes Bitcoin issuance decline towards the total cap of 21 million.See in the lexicon → accumulation (12-24 months before). Market digests previous bear, convinced buyers accumulate, "upcoming halving" narrative builds. Low volatility, moderate volume. 2014-2015, 2018-2019, 2022-2023.
- Phase 2: Halving + initial euphoria (0-6 months post-halving). Moderate rise driven by psychological effect and first anticipatory buyers. Volatility rises. Late 2012-early 2013, H2 2016, H2 2020.
- Phase 3: Euphoric peak (12-18 months post-halving). Media FOMOFOMO (Fear Of Missing Out)Fear of missing the rally, which pushes people to buy at the worst moment, near the tops. DCA is the classic antidote.See in the lexicon →, new retail entrants, ATHATH (All-Time High)Highest historical price of an asset. Breaking the previous ATH is a strong psychological signal in Bitcoin cycles.See in the lexicon → reached in adoption + speculation cocktail. Maximum volatility. November 2013, December 2017, November 2021, November 2025.
- Phase 4: Bear capitulationCapitulationFinal phase of a bear market where the last sellers give in to panic, often on record volume. Frequently marks the cycle bottom.See in the lexicon → (18-36 months post-halving). DrawdownDrawdownDecline from a previous peak. Bitcoin has gone through several drawdowns of more than 75 percent in its history. To factor into your psychological planning.See in the lexicon → -75 % to -86 %, capitulation, amplifying events (Mt. GoxMt. GoxFormer Japanese exchange that lost 850,000 BTC in 2014. Textbook case of custodial risk. Partial creditor compensation has been under way since 2024.See in the lexicon → 2014, ICO crash 2018, FTXFTXCentralised exchange that collapsed spectacularly in November 2022. Sam Bankman-Fried was convicted. Dragged Blockfolio and many funds down with it.See in the lexicon → 2022). High volatility during fall, low at bottom. 2014-2015, 2018, 2022.
Then next cycle. Total: ~3.5-4 years between 2 halvings, ~18 months up and ~18 months down.
Why a 12-18 month lag between halving and peak? Several combinable theories.
- (a) Lagged minerMinerComputer or farm of computers that solves the cryptographic puzzle required to add a new block to the blockchain, in exchange for a bitcoin reward.See in the lexicon → supply effect. Halving halves issuance instantaneously. But miners sell their production with delay (weeks to months). Furthermore, some miners hoard until the next rally to sell higher. The real impact on available supply diffuses over 6-12 months.
- (b) Lagged media demand effect. The general public does not follow halving calendars in real time. Mainstream media cover Bitcoin when the price hits records, not at halving itself. Post-halving media coverage amplifies 6-12 months later, attracting new capital. Media cycle = price cycle booster.
- (c) Progressive psychological effect. Early adopters accumulate, detractors sell, equilibrium shifts progressively. The "programmable scarcity" narrative takes 12-18 months to anchor in public opinion.
- (d) Macro cycle convergence. Halvings 2012, 2016, 2020 all coincided with supportive macro contexts (QE post-2008, Trump fiscal 2016, COVID stimulus 2020). The 2024 halving coincided with end of Fed tightening (first rate cuts late 2024). Perhaps not a coincidence: macro 8-year cycles (US elections) and 4-year cycles (halving) overlap.
- (e) Reflexive effect (Soros). Actors anticipate that other actors will anticipate post-halving rise, creating a self-fulfilling loop. The more known the narrative, the more it self-reinforces, until excess (FOMO) and breakdown (capitulation).
Limits of observed pattern.
- Small statistical base. 3 complete cycles is very little to affirm a robust pattern. Stock markets have 100+ years of cycles to calibrate.
- Different macro conditions each cycle. 2012 (post-GFC, QE), 2016 (Trump-fiscal), 2020 (COVID-stimulus), 2024 (ETF-institutional). No identical repetition.
- 2024 institutional adoption changes demand composition. Spot ETFs bring constant programmatic demand, different from cyclical retail speculative demand. The pattern may deform or fade.
Strategic consequences for the investor
If we accept that the 4-year pattern exists (with its limits), four practical strategic consequences emerge for the investor.
1. Pre-halvingHalvingScheduled event every 210,000 blocks (roughly every 4 years) that cuts the miner reward in half. This mechanism makes Bitcoin issuance decline towards the total cap of 21 million.See in the lexicon → accumulation historically profitable.
- The 12-24 months preceding a halving correspond to the previous bear bottom + accumulation. This is the phase where valuations are lowest and psychology most negative. Statistically, the best moment to accumulate aggressively.
- Examples: who accumulated in 2015 (before July 2016 halving, BTC ~250 USD) multiplied by 80 in 2 years. Who accumulated in 2019 (before May 2020 halving, BTC ~7,000 USD) multiplied by 10 in 2 years. Who accumulated in 2022-2023 (before April 2024 halving, BTC ~20-40k USD) multiplied by 3-4 in 2 years.
- For the next cycle: 2027 (pre-2028 halving) will likely be the most profitable accumulation phase, if the pattern continues. But with a decreasing expected multiplier (perhaps x2 only, not x3-x10).
2. Post-halving peak partial selling historically profitable.
- Euphoric peaks 12-18 months post-halving offer the opportunity to sell a fraction (15-30 %) of the portfolio at exceptional prices. Defensive "sell some, hold most" strategy rather than total sale.
- Examples: who sold 25 % in December 2017 at 16k EUR/BTC secured a nice gain before the -84 % bear. Who sold 25 % in November 2021 at 58k EUR/BTC secured before -77 %. Who sold 25 % in November 2025 at 95k EUR/BTC secured before the ongoing potential bear.
- Crucial limit: identifying the peak in real time is extremely difficult. Indicators (monthly RSI > 80, MVRV > 3, Pi Cycle Top) helped retrospectively but produced many false signals. Automatic partial selling discipline (e.g. "if BTC exceeds 2x previous ATHATH (All-Time High)Highest historical price of an asset. Breaking the previous ATH is a strong psychological signal in Bitcoin cycles.See in the lexicon →, sell 5 % per month until -50 % of portfolio") avoids timing paralysis.
3. Cycle-insensitive strategies: permanent DCADCA (Dollar Cost Averaging)Buying a small fixed amount at regular intervals (for example 100 EUR a week), regardless of price. Smooths the average purchase cost and neutralises timing bias.See in the lexicon → and deep lump-sumLump-sumInvesting all available capital at once rather than spreading it out. Mathematically better on average historically on Bitcoin, but psychologically harder to bear.See in the lexicon →.
- Permanent DCA (see Bitcoin DCA method): DCA's beauty is that it adapts automatically to cycles. In bear, it buys more BTC for the same fiatFiat (fiat currency)State currency with legal tender status (euro, Swiss franc, dollar), issued by a central bank and not backed by a physical asset. By contrast, Bitcoin has an issuance capped at 21 million units, with no central issuer.See in the lexicon → amount. In bull, less. Over 8-12 years (2-3 cycles), mechanical DCA beat the overwhelming majority of active strategies, avoiding human timing errors.
- Lump-sum at bear bottom (see lump-sum vs DCA): if sufficiently convinced of being near bottom (-70 % drawdownDrawdownDecline from a previous peak. Bitcoin has gone through several drawdowns of more than 75 percent in its history. To factor into your psychological planning.See in the lexicon → or more, media capitulationCapitulationFinal phase of a bear market where the last sellers give in to panic, often on record volume. Frequently marks the cycle bottom.See in the lexicon →, extreme on-chain indicators), lump-sum at this historically explosive moment. December 2018, November 2022 were bottoms identifiable a posteriori as "capitulation zones". 2026?
- Pragmatic combination: permanent DCA in background (50-70 % of savings flow) + lump-sum opportunism in deep bear (30-50 % kept in reserve for opportunities).
4. Decreasing multipliers imply expectation recalibration.
- The era of +5,000 % cycles (2012-2013) is over. The 2024-2028 cycle will likely be more modest (x1.5 to x3 from 2026 bottom if bottom at 25-35k, so 2029 peak at 50-100k... or 200k in optimistic hypothesis).
- For new investors in 2026: entering expecting +100x is unrealistic. Entering aiming +50-150 % per cycle (3-4 years) is more aligned with current projections. The Bitcoin thesis remains valid but asymmetric returns moderate.
- For long-time Bitcoiners: review exit targets. Selling at 500k USD as "2024 halving" target is probably off. Revise to 200-300k USD if aiming a reasonable horizon.
Disclaimer
Educational and informational content only: not investment, tax or legal advice. Bitcoin carries significant risks, including high volatility and the possible loss of invested capital. Each reader remains responsible for their decisions; when in doubt, consult a qualified professional in your jurisdiction.
Going further
The halvingHalvingScheduled event every 210,000 blocks (roughly every 4 years) that cuts the miner reward in half. This mechanism makes Bitcoin issuance decline towards the total cap of 21 million.See in the lexicon → pattern and 4-year cycles constitute an anticipation framework among others. To explore complementary dimensions:
- Invest Bitcoin guide: overview of strategies, asset allocation, global psychology.
- Bitcoin halving: for the technical detail of the mechanism (proof of workProof of Work (PoW)Bitcoin's consensus mechanism: miners spend energy to find a valid hash, which makes falsifying the history economically prohibitive. This work is what secures the blockchain.See in the lexicon →, difficulty, mempoolMempoolWaiting area where Bitcoin transactions sit before being included in a block. The fuller the mempool, the higher the fees required.See in the lexicon →, miners).
- Bitcoin DCA method: the cycle-insensitive strategy, ideal complement to pre-halving accumulation.
- Lump-sum vs DCA: the timing decision applies differently depending on cycle phase.
- Bitcoin spot ETF comparison: spot ETFs bring programmatic demand that could modify cycle nature.
For underlying technical basics:
- Buy Bitcoin guide: how to concretely take action in pre-halving accumulation phase.
- Store Bitcoin guide: self-custodySelf-custodyModel in which you hold your own private keys. Your bitcoins depend on no third party. This is Bitcoin's founding promise.See in the lexicon → to peacefully traverse bear markets without touching core position.
Cycle peak exit strategies (25 % partial sale, psychological top markers, progressive divestment) will be detailed in the upcoming bitcoin-exit-strategy article (sprint 5).